Electric Vehicles
Why EV range figures never match your dashboard
The number on the sticker comes from a laboratory cycle. The number on your screen comes from a Tuesday in February.
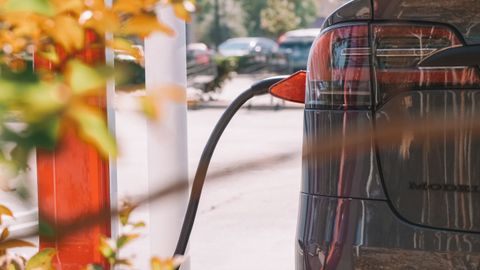
Every electric car is sold with a range figure, and almost every owner discovers within a fortnight that it is optimistic.
This is not fraud. It is a measurement problem, and understanding it tells you more about how an EV actually behaves than any review will.
Where the number comes from
Range is measured on a standardised drive cycle — a defined speed-versus-time profile run on a dynamometer in a temperature-controlled room.
Different regions use different cycles, which is why the same car is advertised with different ranges in different markets.
The European WLTP cycle and the American EPA procedures both attempt to be realistic, and both are still laboratory tests. They run at moderate temperature, with no headwind, no roof rack, no heating, no passengers and a specific acceleration profile.
The point of a standard cycle is comparability between vehicles, not prediction of your commute. It does the first job reasonably well and the second badly.
What actually consumes the battery
Speed. The dominant factor at motorway pace.
Aerodynamic drag rises with the square of velocity, and the power required to overcome it rises with the cube. Which means a car that returns comfortable range at 100 km/h can lose a large fraction of it at 130.
This is why EV range collapses on a long motorway run and holds up remarkably well in town — the opposite of a combustion car, where stop-start driving is the inefficient case.
Temperature. The second largest factor, and the one that surprises new owners in their first winter.
Lithium-ion cells have higher internal resistance when cold, which reduces both available capacity and charging speed. On top of that, cabin heating in an EV draws directly from the traction battery, because there is no waste engine heat to scavenge.
Cold-weather range losses of a quarter to a third are routinely measured, with the worst cases involving short journeys where the car never warms through.
Heat pumps mitigate this substantially compared with resistive heaters, which is why they have moved from a luxury option to near-standard.
Elevation. Climbing costs energy in proportion to mass and height gained. Regenerative braking returns some of it on the way down — typically most, not all.
Payload and towing. Mass matters more in acceleration and climbing than in steady cruising, but towing adds frontal area and drag, and range while towing is frequently around half.
Wheels and tyres. Larger wheels with wider, lower-profile tyres look better and cost range through both mass and rolling resistance. The difference between the base wheel and the largest option can be several percent.
Reading the dashboard estimate
Most cars display a range estimate derived from recent consumption, which means it is a rolling average of how you have been driving.
Some display a fixed figure derived from state of charge and the rated efficiency, which is stable and less honest.
The useful display is consumption — watt-hours per kilometre or miles per kilowatt-hour — because it is a direct measurement rather than a projection.
Learn your car's figure in summer town driving, in winter town driving and on the motorway. Three numbers, and you can plan any journey without trusting the estimate at all.
The buffer
Manufacturers reserve a portion of the pack at both ends.
The top buffer protects against over-charging; the bottom buffer prevents deep discharge, which damages cells. Usable capacity is therefore smaller than nominal capacity, sometimes by several kilowatt-hours.
Which means a pack advertised at a given size does not deliver all of it, and the difference varies by manufacturer.
Degradation
Batteries lose capacity over time and over cycles.
Fleet data from several manufacturers suggests typical losses in the region of a few percent over the first year, then a slower ongoing decline — with substantial variation by chemistry, climate and charging habit.
The factors that accelerate it are consistent: sustained high state of charge, high temperature, frequent rapid DC charging, and deep discharge cycles.
The habits that slow it are equally consistent: charging to eighty percent for daily use, avoiding leaving the car at very high or very low charge for long periods, and using AC charging where practical.
Lithium iron phosphate chemistry behaves differently and is generally happier being charged to full, which is why manufacturers using it advise exactly that.
What to actually do with all this
Treat the sticker figure as a comparison tool between cars, not a promise.
Plan real journeys on consumption, in the conditions you will actually drive, with a reserve.
Assume a winter motorway run returns substantially less than the advertised figure. In practice, planning at around two-thirds of the rated range for a cold-weather long trip is realistic and leaves margin.
And accept that the number was never going to match. It is measured on a rolling road in a warm room, and your commute is not.